RANKINGS
Current and forecast offshore wealth
Powered by
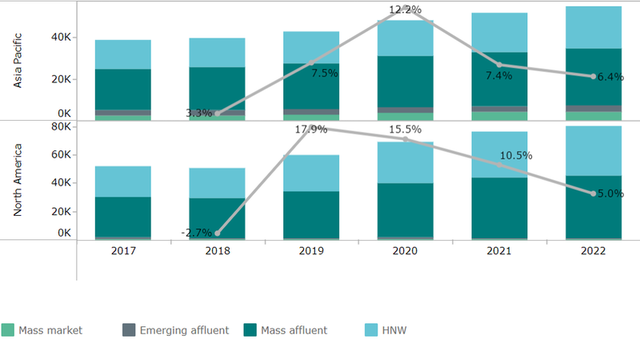
This issue’s graph shows the liquid assets between 2017 and 2022 in both North America and Asia Pacific. It also shows the growth levels between years and which wealth band in which the assets lie.
| Affluent band | Region / Country | Value |
| $1m - 1.5m | Central and Eastern Europe | 99907.768693143 |
| $1m - 1.5m | Middle East and Africa | 109996.130667997 |
| $1m - 1.5m | Latin America | 130065.694074167 |
| $1m - 1.5m | Western Europe | 1008435.95121348 |
| $1m - 1.5m | Asia Pacific | 2370440.50394262 |
| $1m - 1.5m | North America | 3899292.55171799 |
| $1.5m - 3m | Central and Eastern Europe | 138559.665411904 |
| $1.5m - 3m | Middle East and Africa | 152559.94245186 |
| $1.5m - 3m | Latin America | 180386.625791534 |
| $1.5m - 3m | Western Europe | 1398550.43754408 |
| $1.5m - 3m | Asia Pacific | 3287393.4211973 |
| $1.5m - 3m | North America | 5407672.51534426 |
| $3m - 10m | Central and Eastern Europe | 199885.25306992 |
| $3m - 10m | Middle East and Africa | 220084.991043881 |
| $3m - 10m | Latin America | 260249.889257525 |
| $3m - 10m | Western Europe | 2017824.51423251 |
| $3m - 10m | Asia Pacific | 4743069.90344138 |
| $3m - 10m | North America | 7802184.82145118 |
| $10m - 30m | Central and Eastern Europe | 98603.591296839 |
| $10m - 30m | Middle East and Africa | 118817.745359329 |
| $10m - 30m | Latin America | 119756.763253105 |
| $10m - 30m | Western Europe | 1211599.82526461 |
| $10m - 30m | Asia Pacific | 3551903.75086182 |
| $10m - 30m | North America | 5537533.22524025 |
| $30m-99.99m | Central and Eastern Europe | 93816.52875679 |
| $30m-99.99m | Middle East and Africa | 108997.202921491 |
| $30m-99.99m | Latin America | 147585.861547333 |
| $30m-99.99m | Western Europe | 821219.10205169 |
| $30m-99.99m | Asia Pacific | 1331176.37373251 |
| $30m-99.99m | North America | 2234576.1207353 |
| $100m+ | Central and Eastern Europe | 113132.972378477 |
| $100m+ | Middle East and Africa | 159596.521273765 |
| $100m+ | Latin America | 110221.400445397 |
| $100m+ | Western Europe | 787325.776096932 |
| $100m+ | Asia Pacific | 1797485.37523747 |
| $100m+ | North America | 3099550.27063002 |